How to Convert an Image to SVG for Pen Plotting
Convert a photo into plotter-ready SVG line art: compare squiggle, spiral, stipple, hatching and flow field algorithms on sample images and tune the settings.
By DrawingBots · Published
Pixels versus paths
A photo is a grid of coloured pixels. A pen plotter can only follow paths: lines the pen puts down, moves along, and lifts. Converting an image to SVG for plotting therefore means inventing lines that suggest the photo, not tracing it. Dark areas get more ink (denser waves, more dots, closer hatching) and light areas get less.
DrawingBots’ Image to SVG does this in the browser with 40 algorithms, each a different way of turning tone into line. It is based on plotterfun by mitxela and never uploads your image. Placing a JPEG inside an SVG file does not do the same job: the file is still a raster image and the plotter has nothing to draw.
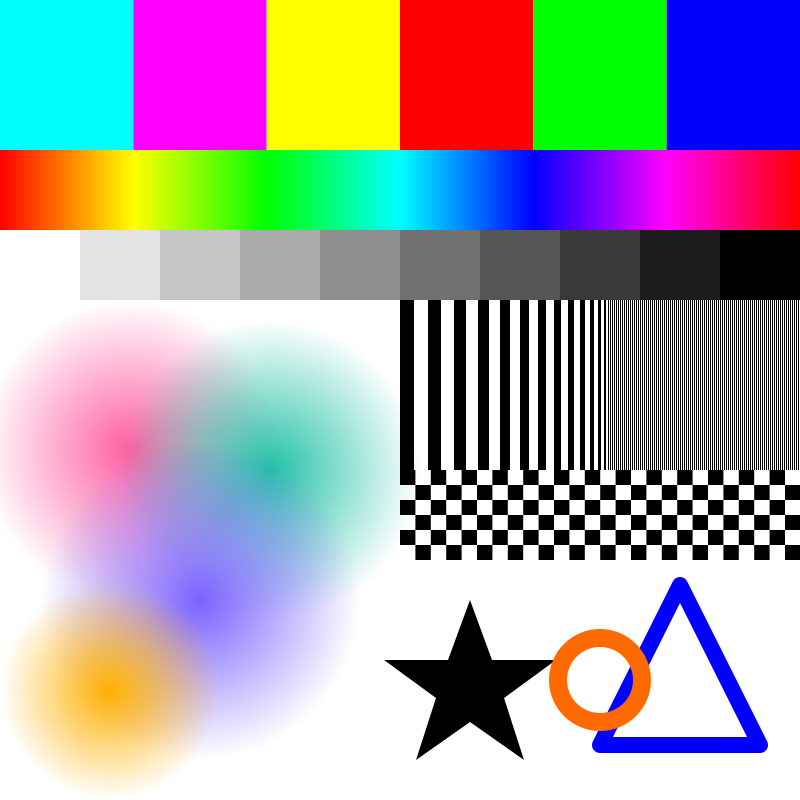
This guide uses three sample files you can download and follow along with: a cat photo, a corgi photo, and a colour test chart used in the multi-colour guide. All are 800 × 800 pixels.
Choose and prepare an image
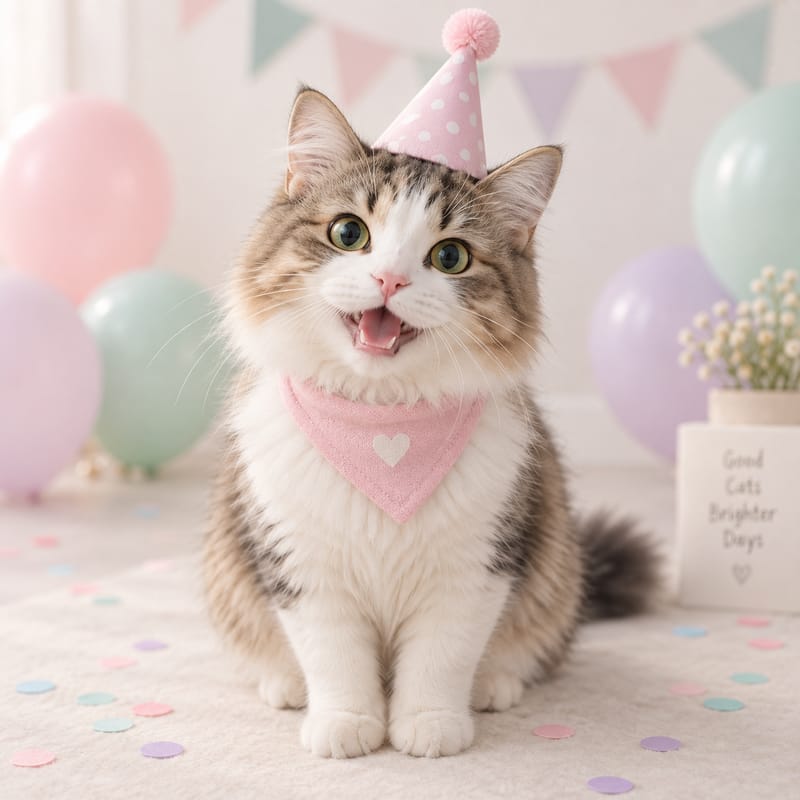
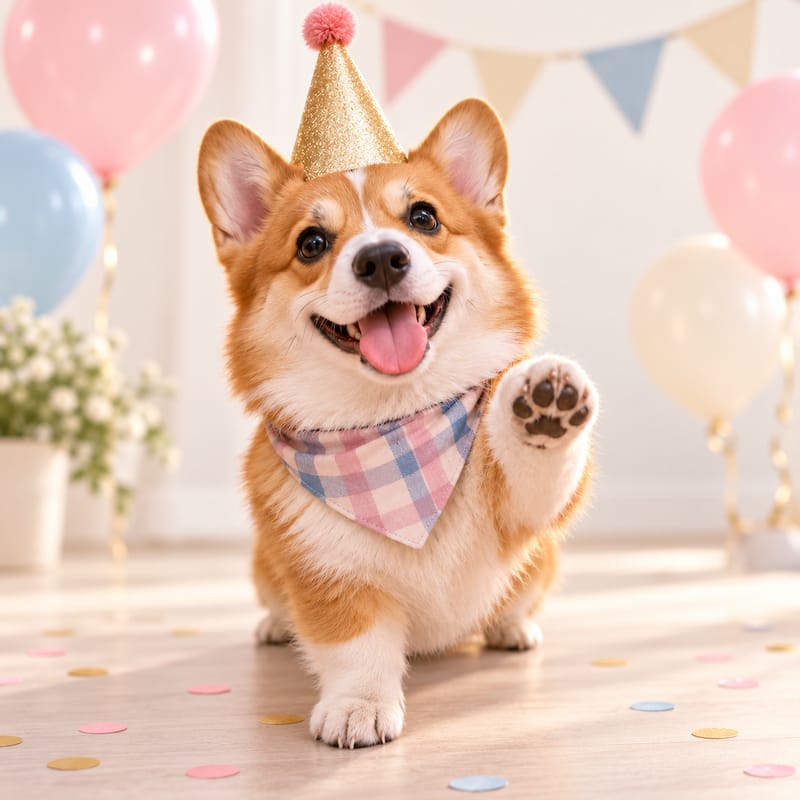
The algorithm only sees brightness, so what makes a good plotter image is different from what makes a good photo:
- Contrast between subject and background matters most. The corgi’s dark eyes and nose become clear marks; the cat’s white chest against a white wall barely registers until the contrast is raised (see below).
- Simple backgrounds convert better. Balloons and bunting become blobs of medium tone that compete with the face.
- Resolution hardly matters beyond about 1,000 pixels on the long side. The tool works on a canvas of the size you set in Width (px) and Height (px), 800 × 600 by default, and it adopts the image size when a smaller image is loaded.
- Square or near-square crops fit most paper sizes and keep the line count manageable.
You can crop and adjust brightness in any photo editor first, or use the tool’s own Brightness, Contrast, Blur radius, Min brightness and Max brightness controls, which are shared by every algorithm.
Load, frame and convert
- Open Image to SVG. Under Source keep Photo selected and click Choose image…. Pick
sample-cat.jpg. - The photo appears in the small preview box. Drag to pan and scroll to zoom; this is your crop. Leave it as it is for the first try.
- Click Use image. The default Squiggle algorithm starts immediately and the result streams into the main panel while it computes.
- Change Algorithm to try another method. The controls under Parameters change with the algorithm; shared adjustments such as Contrast are kept.
- Click Download SVG when you are happy. The file is a plain SVG with one
<path>per line and a physical size in itswidthandheightattributes.
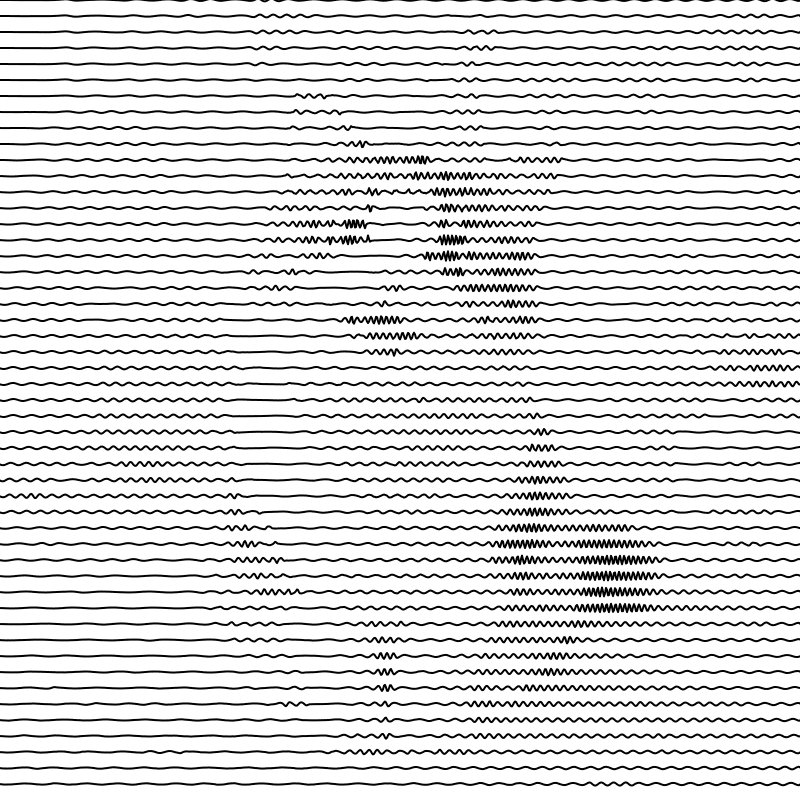
Open this design in Image to SVG · settings: sample-cat.jpg · Squiggle · defaults
Algorithm families compared
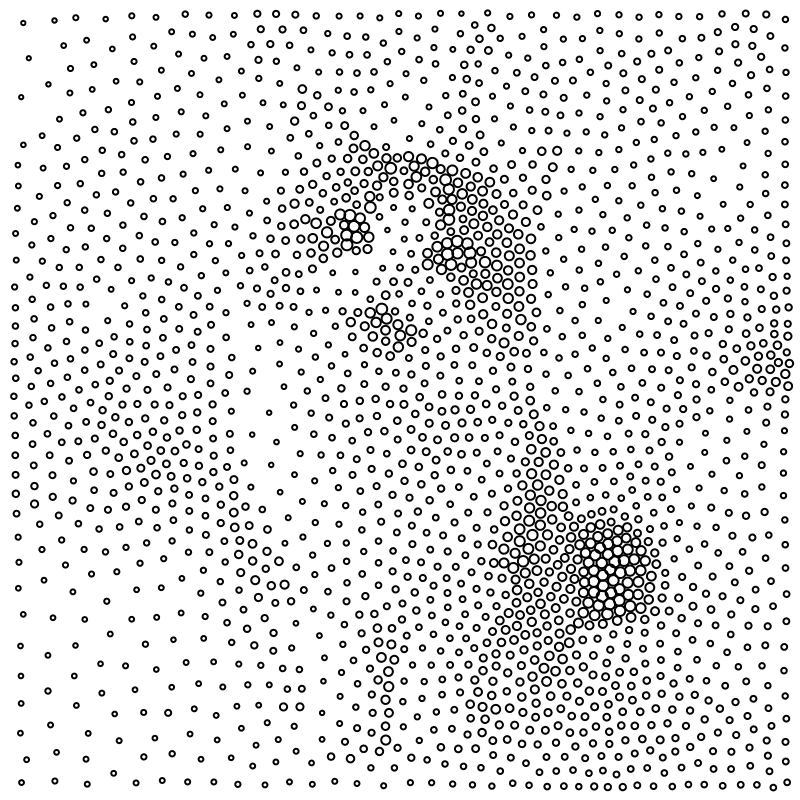
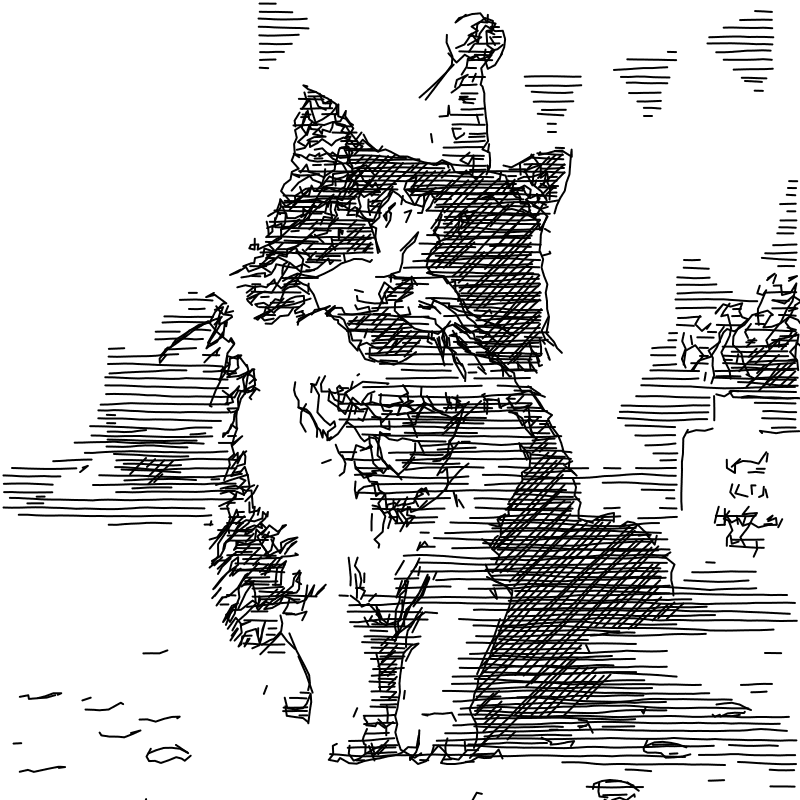
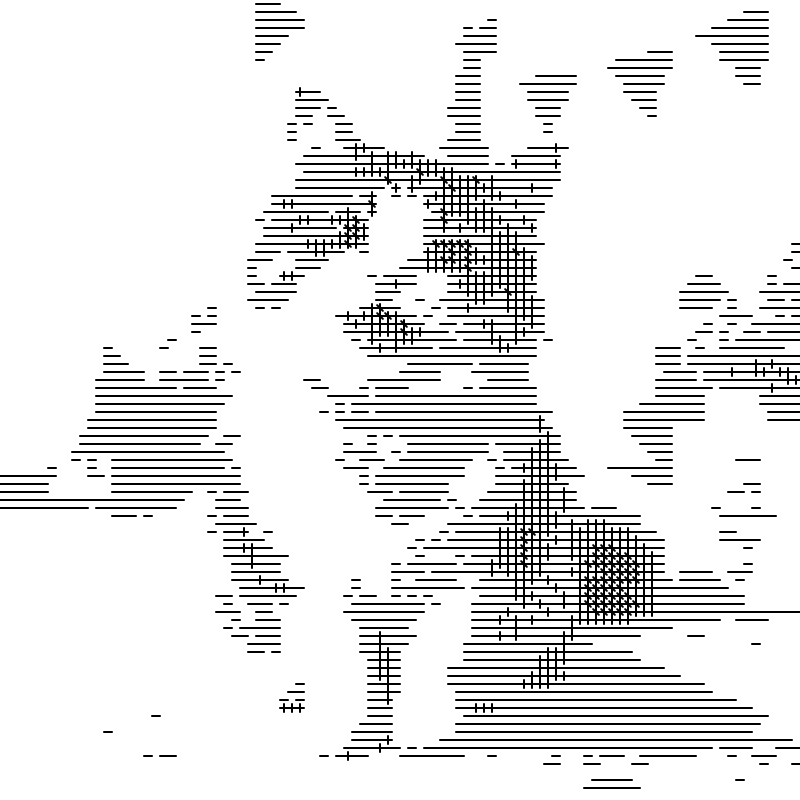
Forty algorithms sounds like a lot, but they fall into a few families. The same cat photo is shown below through one representative of each, all at default settings.
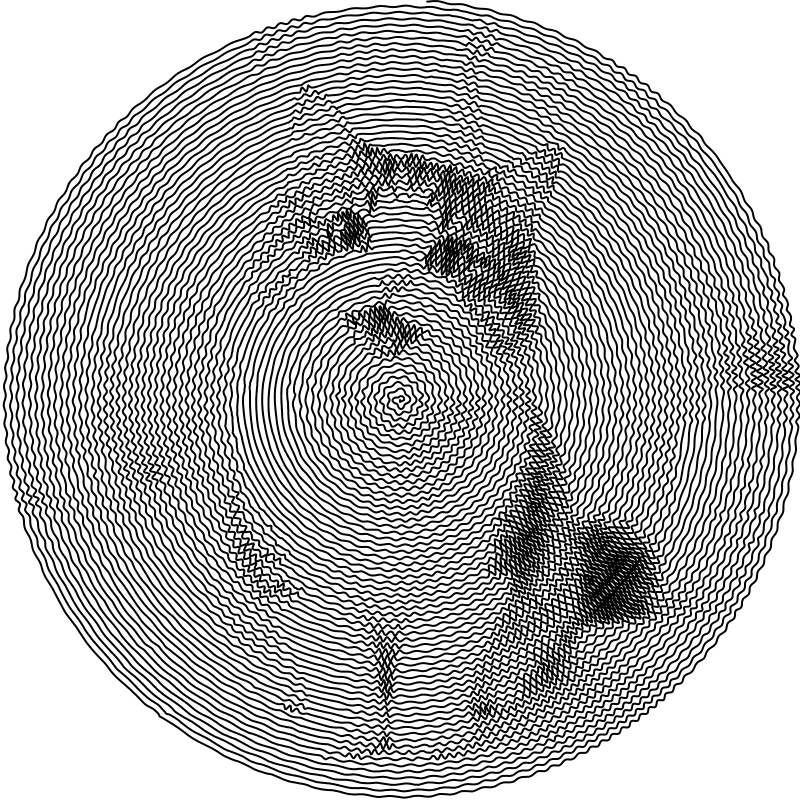
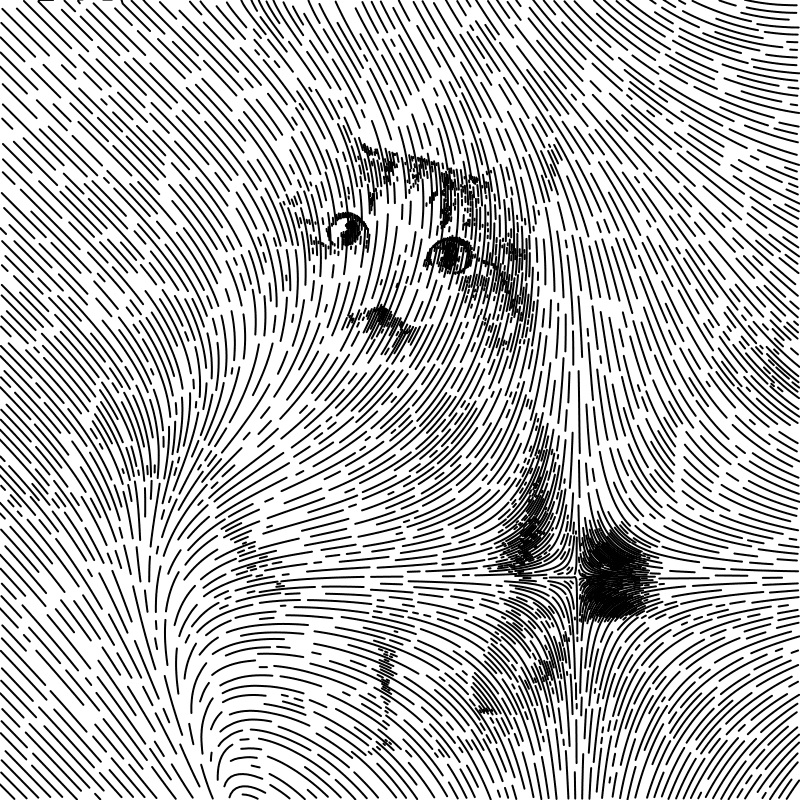
- Tone-following lines (Squiggle, Squiggle Left/Right, Spiral, Polygon Spiral, Sawtooth, Waves, Longwave, Linescan) modulate a fixed set of scanlines. Few pen lifts, predictable plot time, and the classic “plotter portrait” look.
- Dots (Stipples, Stipples (Depth), Dots, Halftone, Circle Pack) place marks by density. Thousands of pen lifts, so they are slow to plot unless you enable TSP Art, which joins the stipples into one continuous path.
- Edges (Linedraw, Contours, Delaunay, Constellation) draw where brightness changes. Best for subjects with clear outlines.
- Hatching (Crosshatch, Hatch Weave, Hatch Moire, Hatch Burst, Hatch Lattice, Woven) fills cells with short parallel lines; the darker the cell, the more directions.
- Texture and growth (Flow Field, Differential Growth, DLA Growth, Reaction Diffusion, Warped Grid, Hex Grid) produce organic patterns steered by the image. They are the most computationally heavy and the most distinctive.
Start with Squiggle or Stipples to judge the crop and contrast, then explore. A result that looks busy on screen usually plots cleaner than it looks, because the pen line is thinner than a browser stroke.
Tune the parameters
Two kinds of settings matter: the shared image adjustments and the algorithm’s own controls. Three comparisons show their effect.
Contrast rescues a flat photo
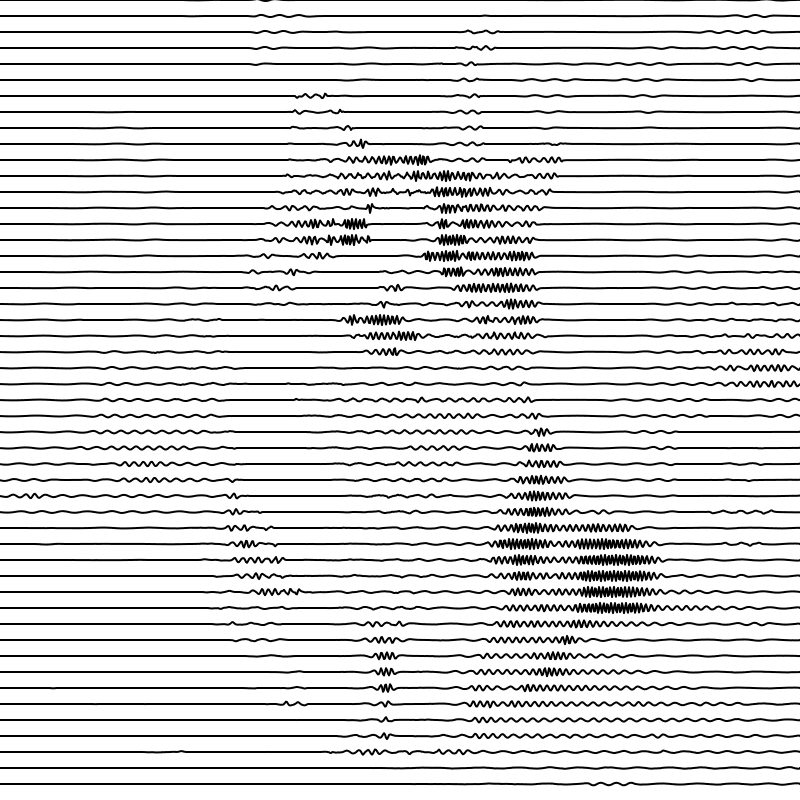
Contrast and Brightness run from −100 to 100. Min brightness and Max brightness clip the tonal range so that near-white areas draw nothing at all. Blur radius smooths noise before conversion, which helps stipple and hatch algorithms on grainy photos. Inverted swaps light and dark for white ink on black paper.
Line Count decides detail and plot time
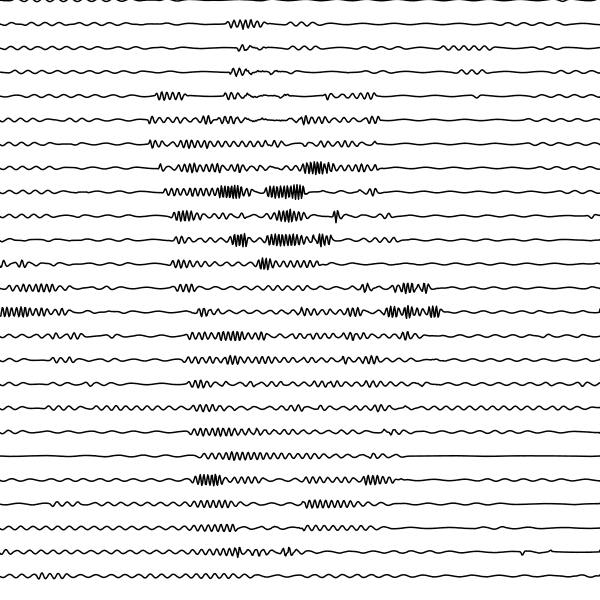
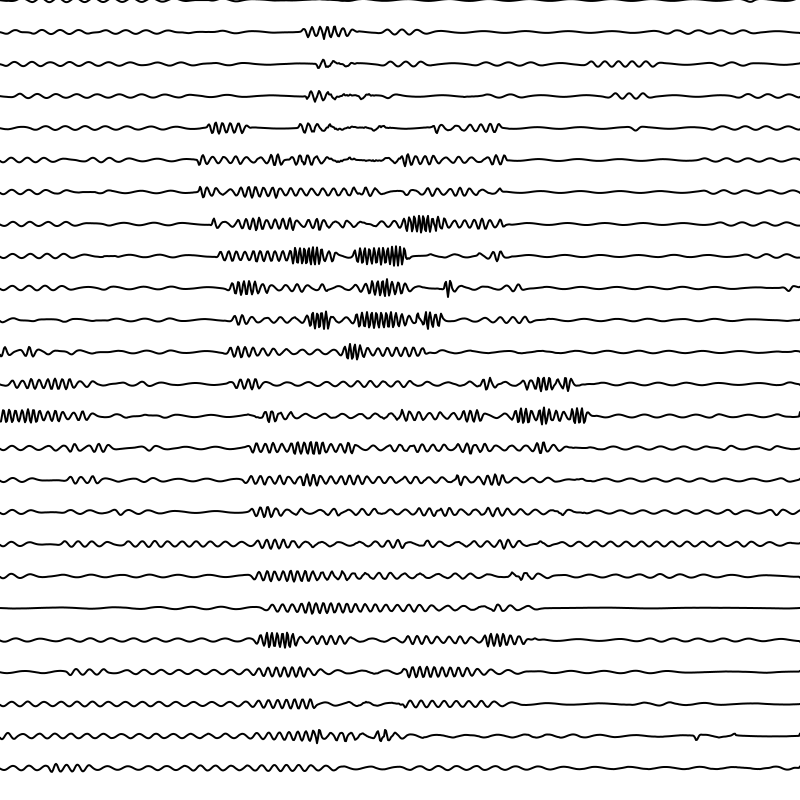
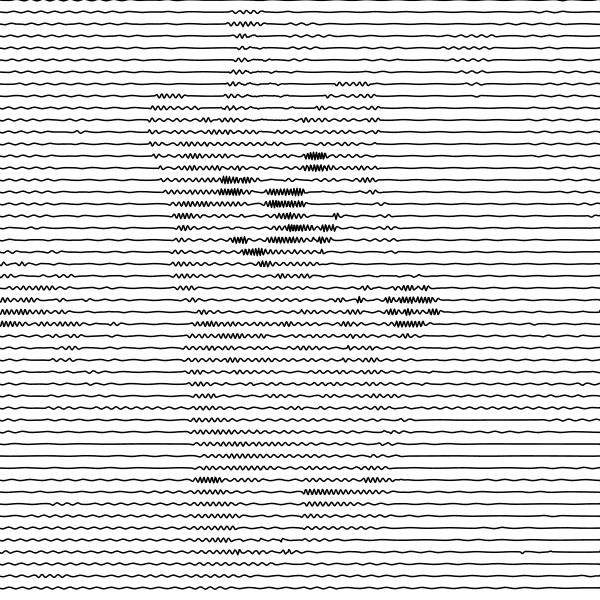
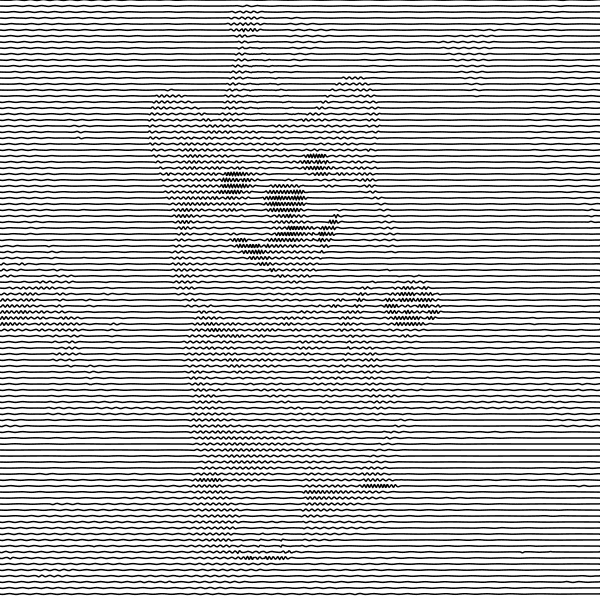
For Squiggle, Frequency sets how tightly the wave oscillates in dark areas, Amplitude its height, and Line Count the number of scanlines. Doubling the line count doubles the points and roughly doubles the plot time. Match it to your pen: at 100 lines on A4 the rows are about 2 mm apart, which a 0.5 mm pen fills nicely and a brush pen turns to mud.
Stipples versus TSP Art
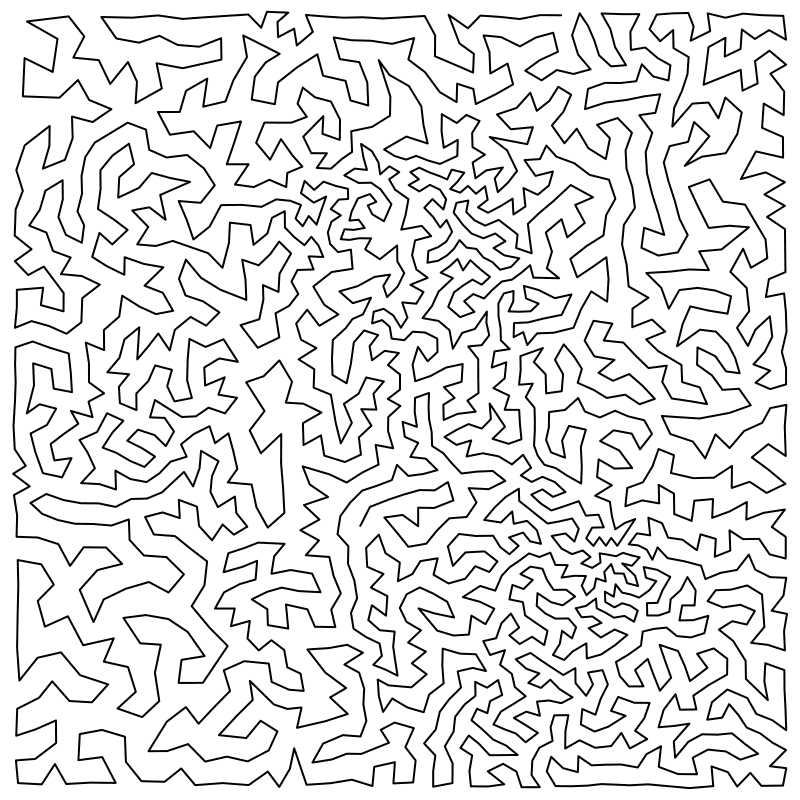
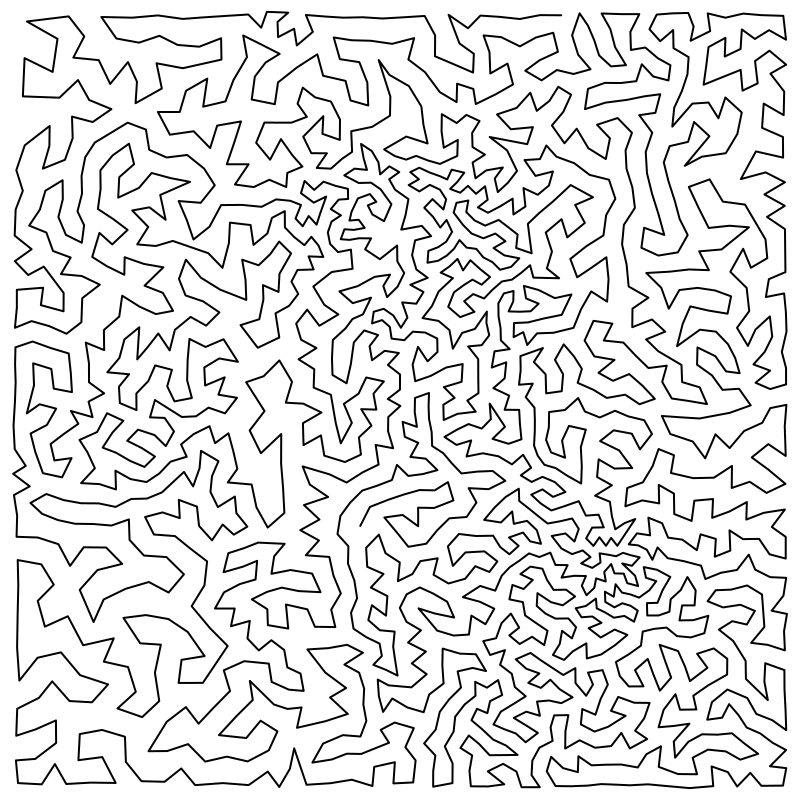
Enabling TSP Art solves a travelling-salesman route through the stipples and exports a single path, which turns the slowest kind of plot into one of the fastest. Max Stipples sets the dot count and Max Iterations how long the dots are relaxed into an even distribution.
Set the size and pen, then export
- Pen width is the stroke width written into the SVG in drawing units. It changes only the preview; the plotter uses the pen in its holder. Set it to roughly match your pen so that dense areas show whether lines will merge.
- Output size is the physical size written into the file. Auto sync from image is on by default and derives it from the canvas at the chosen DPI (an 800-pixel canvas at 96 DPI becomes 8.33 inches); turn it off to type a Width and Height in inches or millimetres, and keep the same proportions as the canvas so the drawing is not letterboxed. The drawing keeps its pixel coordinates in the
viewBox; only the declared size changes, so set it before downloading rather than resizing the file afterwards. - Colour stays on Monochrome for a single pen. The other modes split the drawing into layers per pen and are covered in the multi-colour guide.
After downloading, open the SVG in Plot Preview to see it at real size on your paper with your pen width, and run it through SVG Optimizer: Sort for Plotting reorders thousands of short hatch strokes or stipples to minimise pen-up travel, and Simplify Lines thins out the 40,000-point squiggle file without changing its look. Verify the page size in your plotting software before you send it.
Troubleshooting
- The result is almost blank or almost solid: adjust Brightness and Contrast, or clip the range with Min and Max brightness. Check that Inverted is off for dark ink on light paper.
- The subject is lost in the background: crop tighter in the preview box, or blur and lighten the background in a photo editor first.
- The plot takes hours: reduce Line Count, Max Stipples or hatch density, enable TSP Art for dots, and sort the paths in SVG Optimizer.
- Lines merge into black on paper: the pen is wider than the line spacing. Lower the line count or plot larger.
- The printed size is wrong: set Output size in the tool and confirm it in your plotting software; do not rely on the browser preview.
- The download button is disabled: press Use image first; the button activates once a conversion has started.
The figures on this page are browser exports rasterised for the web; no physical plot of them is claimed. For a different take on the same photos, try Doodle Mosaic, which rebuilds an image from hand-drawn doodles instead of lines.