How to Make Radial Generative Line Art with Rad Lines
Create generative radial line art for pen plotting with Rad Lines: three worked examples with shareable links, formula tips, and plotter-ready SVG export.
By DrawingBots · Published
What Rad Lines draws
Rad Lines is a free browser tool for generative radial line art. It stacks a series of polygons on one page and changes each copy a little: bigger, rotated, or moved. Because every copy is an open stroke rather than a filled shape, the SVG it exports is ready for a pen plotter without any tracing or cleanup.
Three ideas explain almost everything in the sidebar:
- Quantity is how many polygons are drawn. In every formula,
iis the index of the current polygon, counting from 0. - Number of Sides sets the base polygon (3 for triangles, 60 for something close to a circle). Curve Type chooses how the vertices are connected: straight lines, smooth cardinal curves, steps, or squircle corners.
- Scale, Rotation, X Position and Y Position are formulas evaluated once per polygon. Scale is added to Min Radius, rotation is in degrees, and positions are page coordinates on the 800 × 800 default paper.
The design is written into the page URL as you work. Copy the address to save a design or share it, and use Copy Link for the same thing.
Export your first design
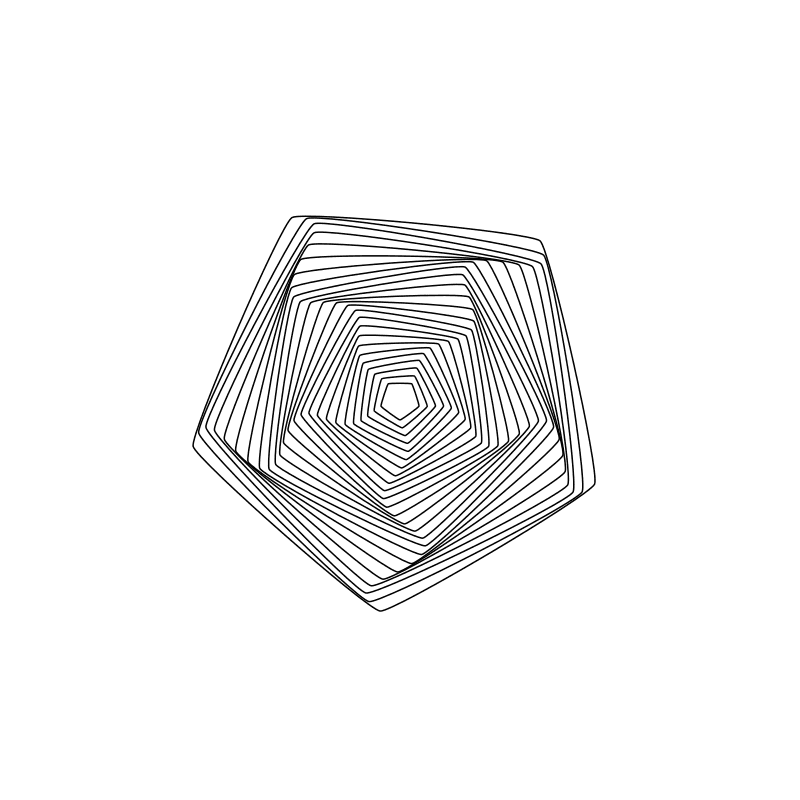
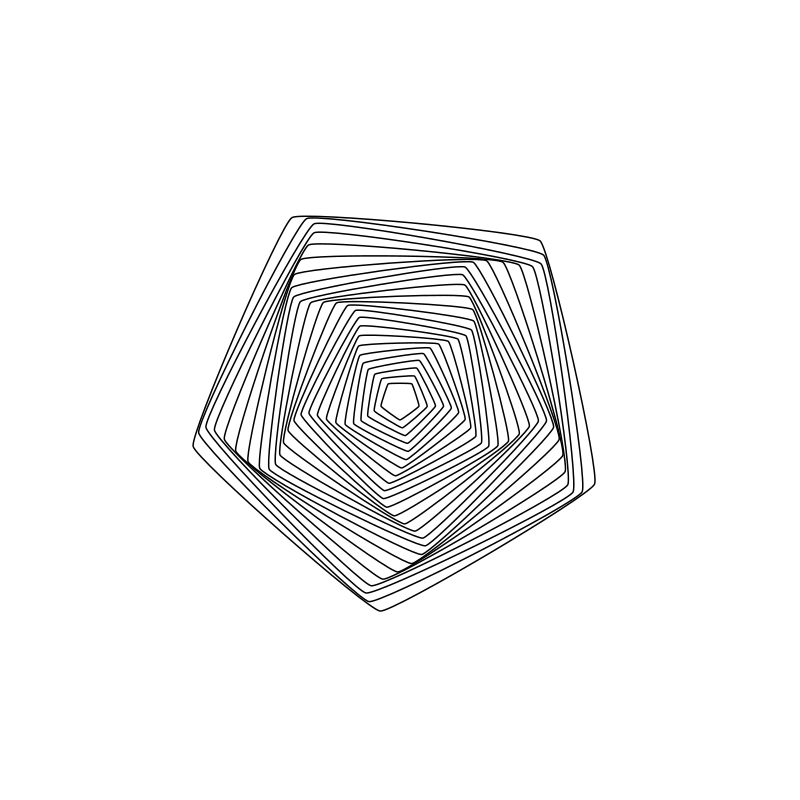
- Open Rad Lines. The default design uses 25 pentagons, the scale formula
i+i*7and the rotation formula10*sin(i/2), connected with the curveCardinalClosed curve. - Drag Quantity and Number of Sides and watch the preview redraw. The sidebar footer shows the current path count and page size.
- Press 🎲 Surprise Me for a random design. The arrows beside it step back and forward through the designs you have seen, so nothing is lost while exploring.
- Click Download SVG. The file contains one
<path>per polygon plus a<desc>element recording every setting.
Open this design in Rad Lines · settings: defaults
Three worked examples
The examples below change only a few settings each. Open a link, then edit one value at a time to see what it does.
Twist: straight lines and steady rotation
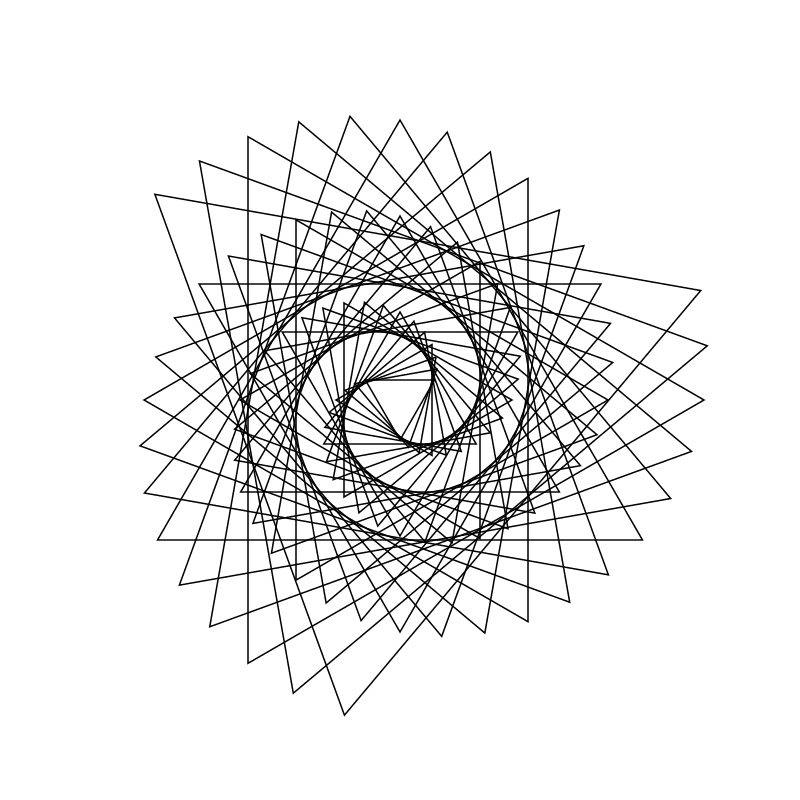
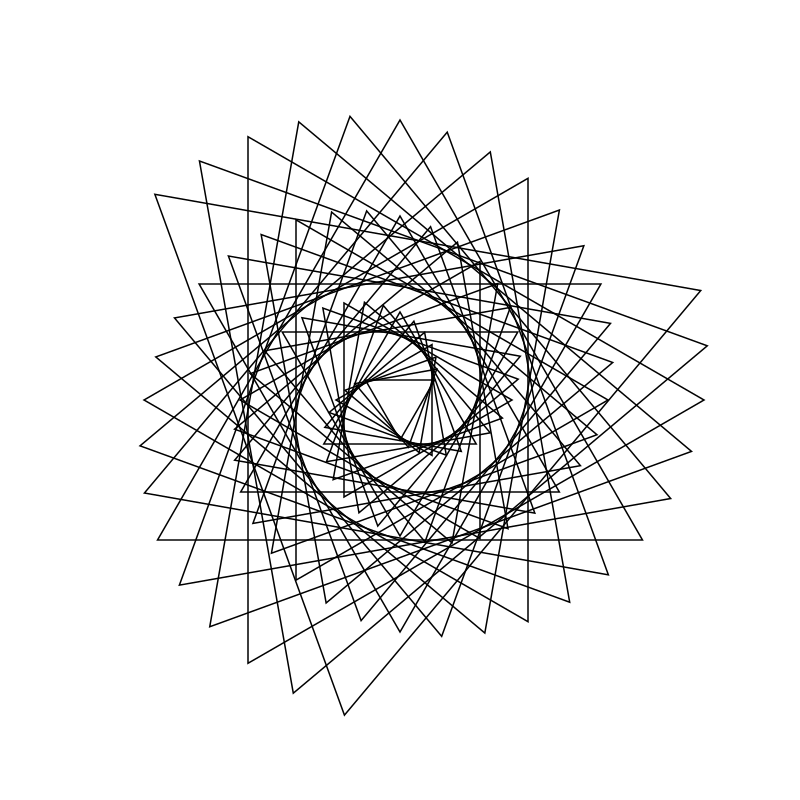
Triangles, 36 copies, straight-line curve type, and two linear formulas: scale i*8+20 grows every copy by 8 units and rotation i*10 turns each one by a further 10 degrees. Only 36 straight-sided paths are needed for the spiral effect.
Open this design in Rad Lines · settings: Number of Sides 3 · Quantity 36 · Scale i*8+20 · Rotation i*10 · Curve curveLinearClosed
Organic: randomized vertices with a seed
Turn on Randomize Vertices and each vertex is placed at a random distance between Min Radius and Max Radius. The Randomization Seed makes the result repeatable: seed 7 always gives this blob. A lower Roundness loosens the cardinal curve.
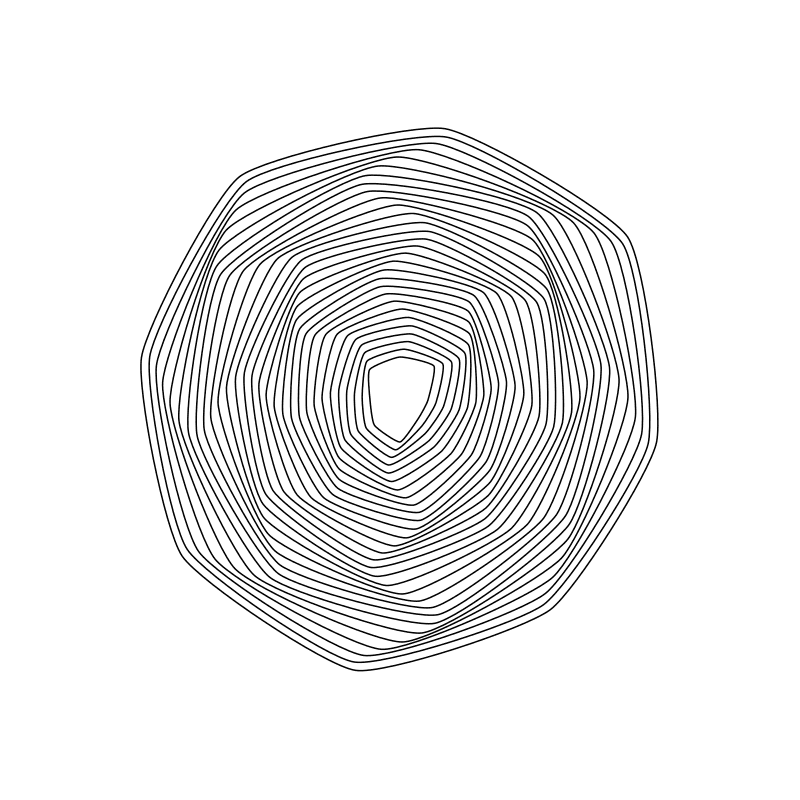
Open this design in Rad Lines · settings: Randomize Vertices on · Seed 7 · Number of Sides 8 · Quantity 30 · Roundness 0.5
Spiral: moving the centre with position formulas
The position formulas can use sin and cos. With 400+i*5*cos(i/3) for X and 400+i*5*sin(i/3) for Y, each square is placed a little further along a spiral around the page centre. Scale is a constant 30, so all squares are the same size, and rotation i*6 turns them as they travel.
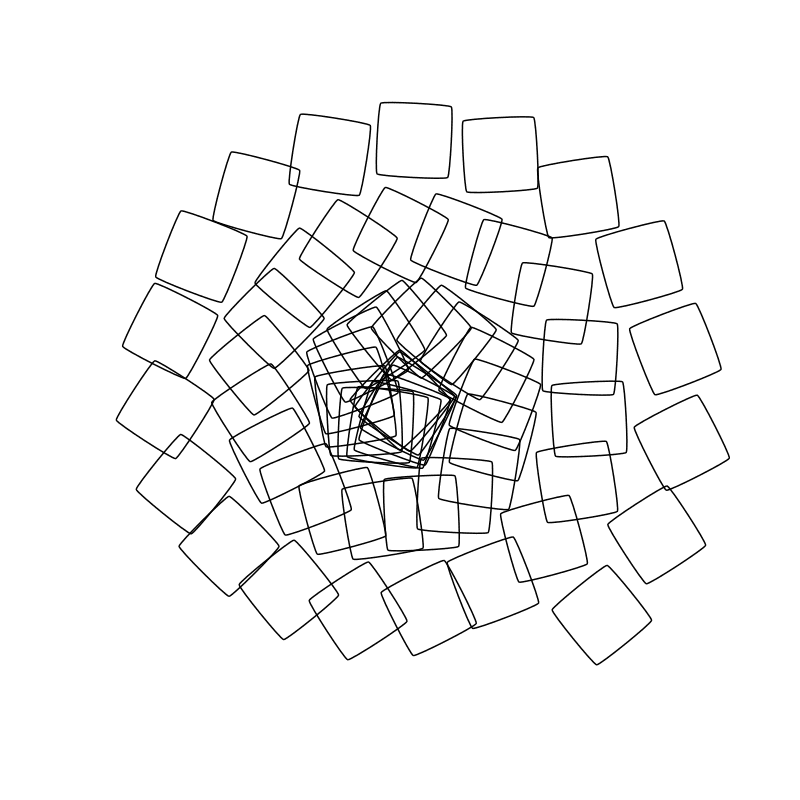
Open this design in Rad Lines · settings: X 400+i*5*cos(i/3) · Y 400+i*5*sin(i/3) · Number of Sides 4 · Quantity 60 · Scale 30 · Rotation i*6
Eight favourite designs, with their settings
These are designs Maks exported from Rad Lines over the years and kept. Every Rad Lines SVG carries its settings in a <desc> element, so each was rebuilt from that record and re-exported from the current tool for this page. The links below load the exact settings; change one value at a time to see what it does.
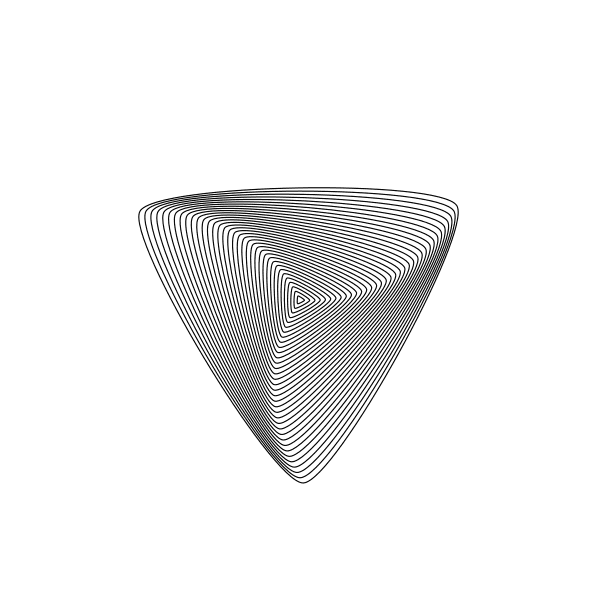
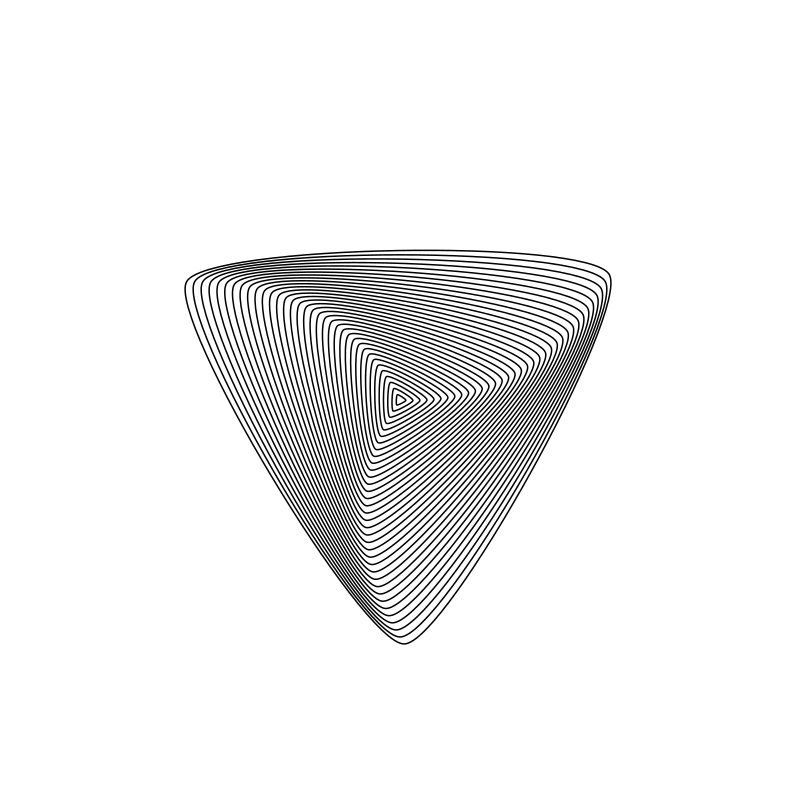
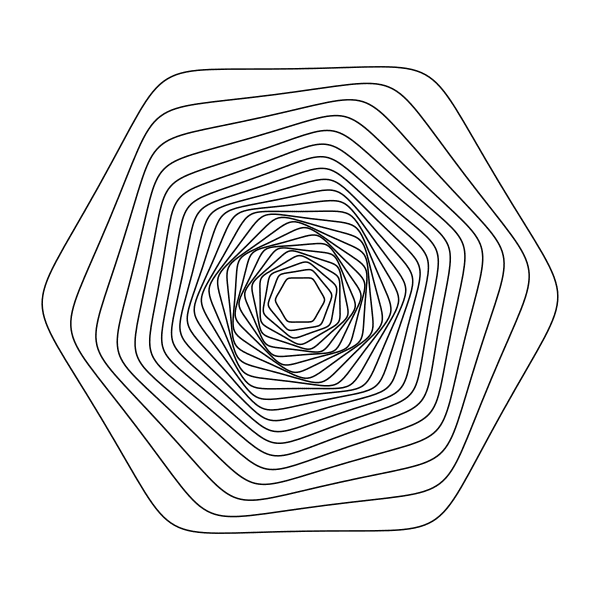
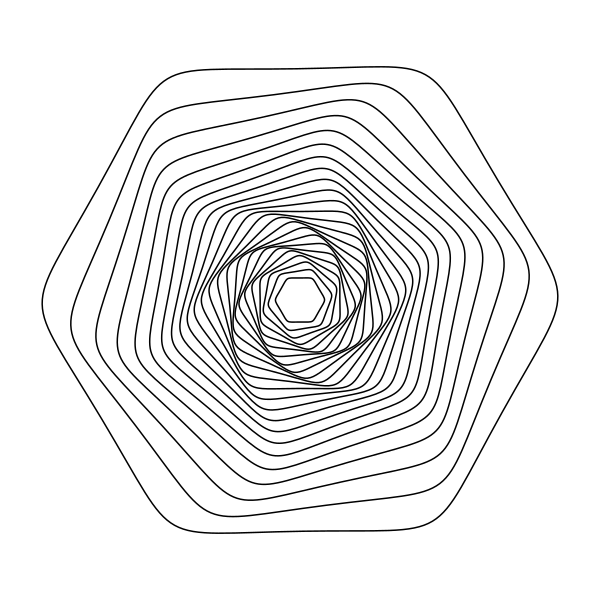
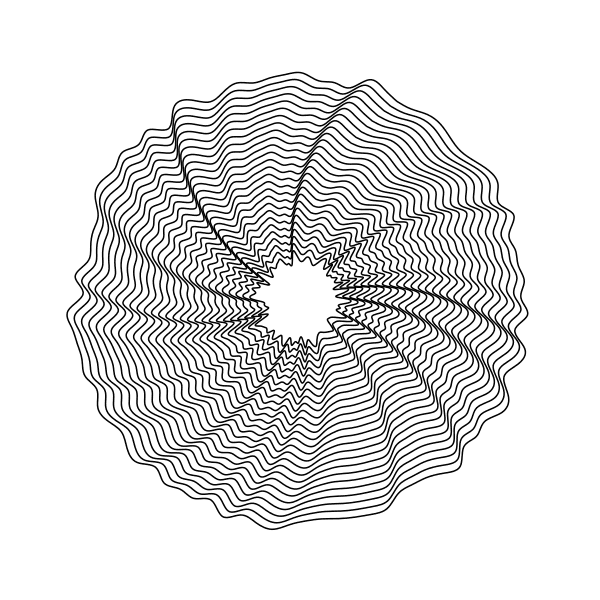
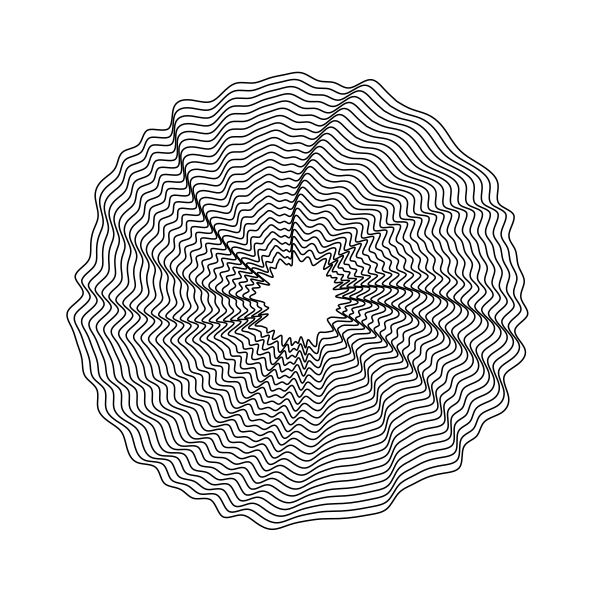
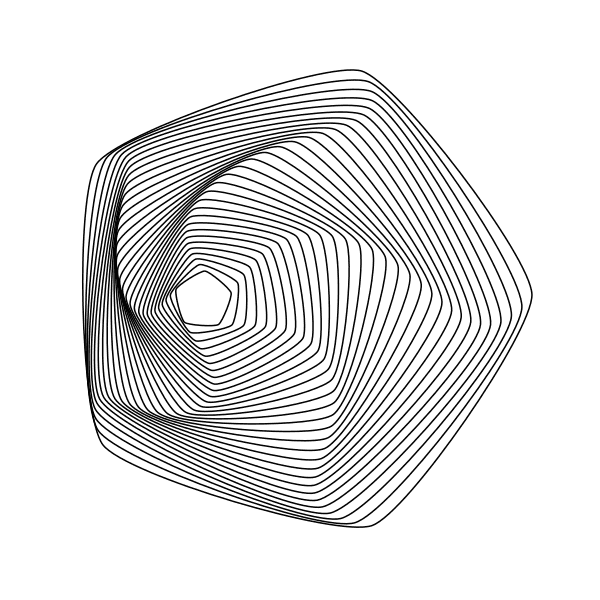
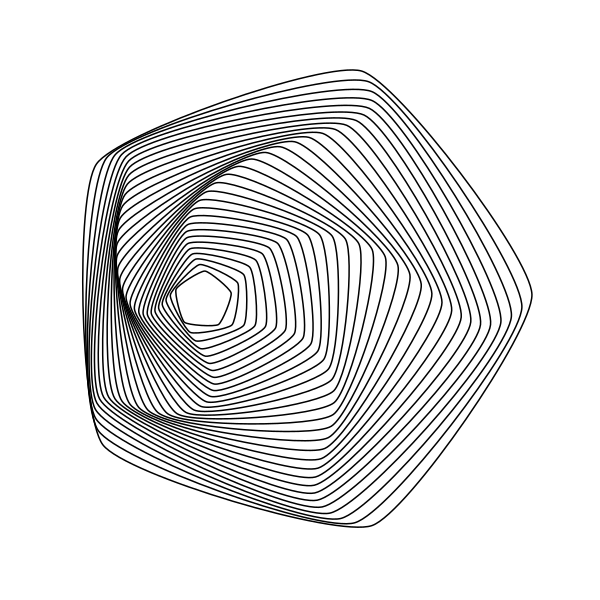
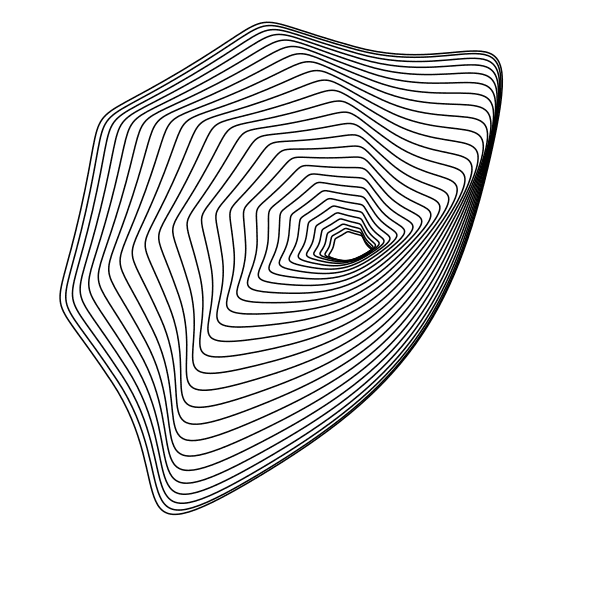
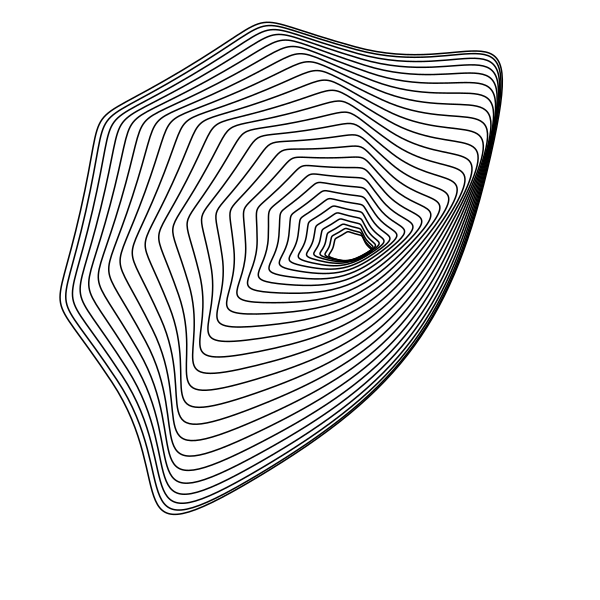
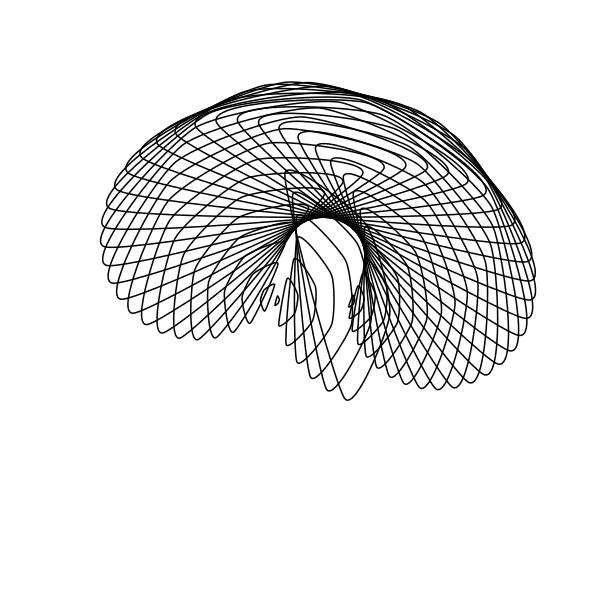
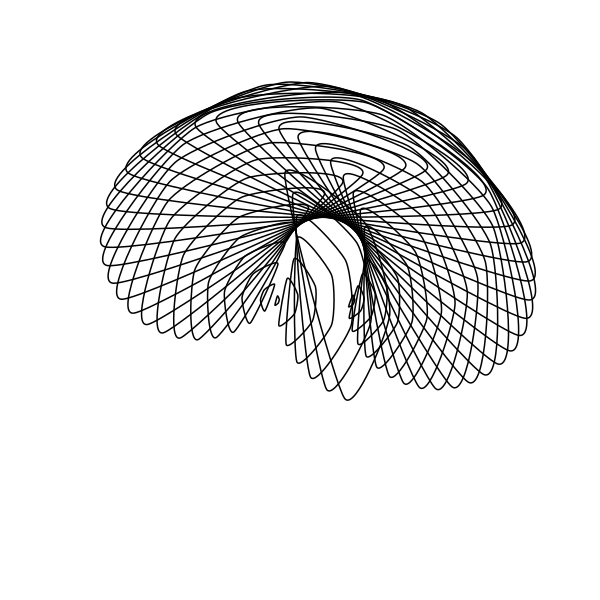
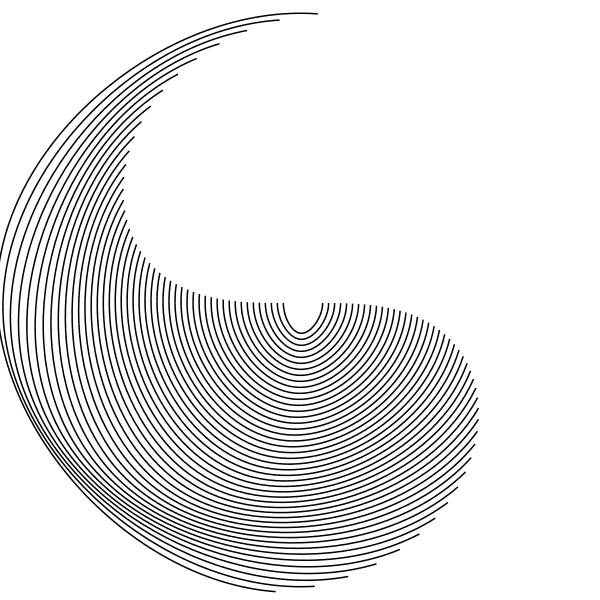
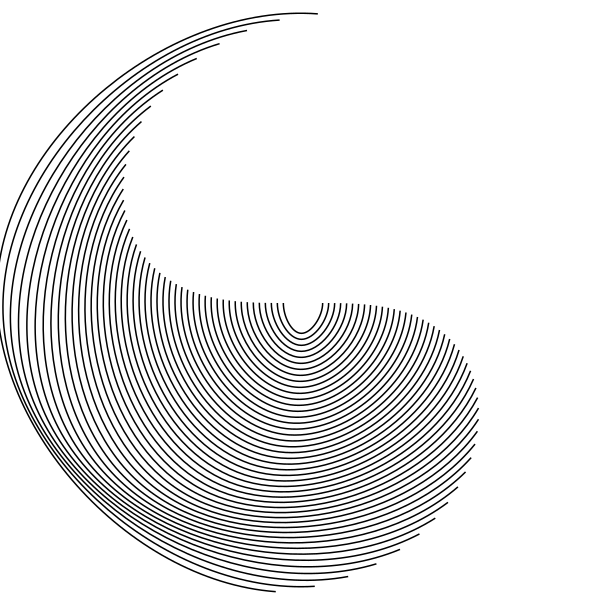
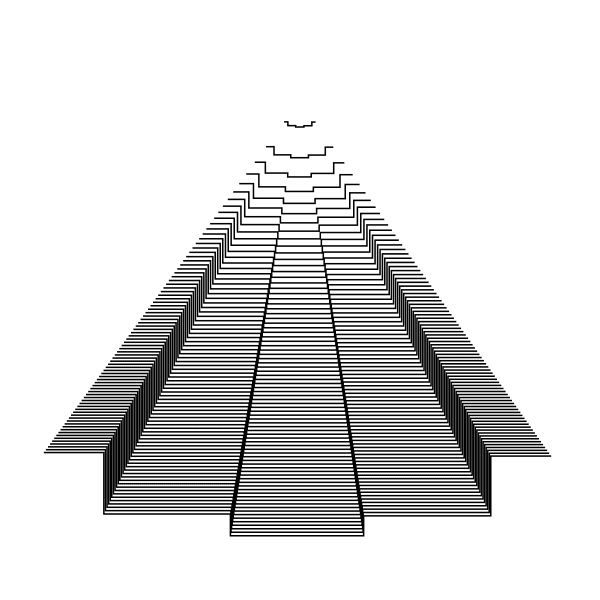
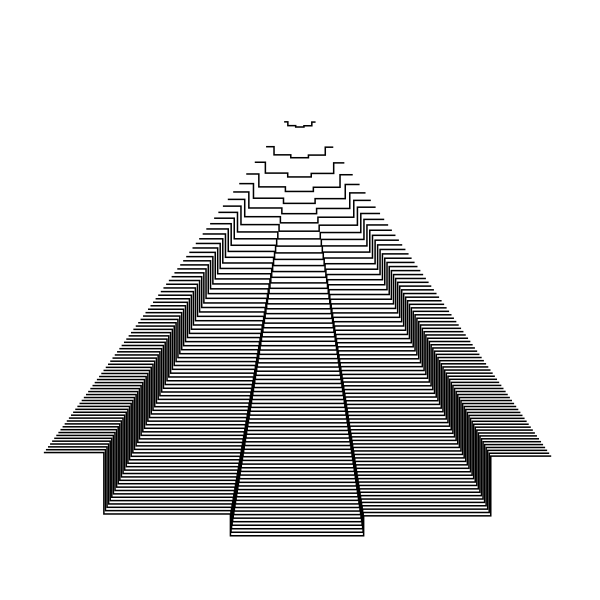
- Triangle vortex. Scale
i*7, rotationi, 35 triangles, Starting Angle 87. The starting angle is what turns a plain spiral into the folded vortex. Open in Rad Lines. - Hex spiral. Scale
i+i^1.6/sin(i/11), rotationsin(i/11)*30log(7i), Roundness −1.3, Starting Angle 55, on a 600 × 600 page. Negative roundness overshoots the corners. Open in Rad Lines. - Corona. 85 sides with Randomize Vertices on and the curveNatural curve; scale
i*7, rotationi, Min Radius 34, Max Radius 50. The random radii are what give the rings their ripple. Open in Rad Lines. - Pentagon twist. X Position
200+3imoves each copy 3 units to the right; rotationcos(i/8)*20log(i/3)rocks it. Open in Rad Lines. - Drifting blob. Arc Extent 278 with Starting Angle 71 leaves every polygon open; the centre wanders with
350-2iand250-10sin(i/6). Open in Rad Lines. - Shell. Arc Extent 173 draws half-polygons; scale
sin(i/12)*50log(4i)grows and shrinks them, rotation5ifans them out. Open in Rad Lines. - Yin-yang. An open curve type (curveBasisOpen) with Randomize Vertices and both radii at 0, so each polygon collapses to a sweeping stroke; rotation
i*tan(i/40)accelerates the turn. Open in Rad Lines. - Staircase. The curveStep interpolator turns 80 pentagon arcs (Starting Angle 323, Arc Extent 89) into a stepped pyramid; scale
3i+40log(i). Open in Rad Lines.
Formulas use mathjs syntax, so 7i, 30log(7i) and i^1.6 are all valid. Where log(i) is undefined at i = 0 the tool simply skips that first polygon. If you have older Rad Lines exports of your own, open the file in a text editor: the settings in its <desc> map straight onto the sidebar (xf and yf are the X and Y Position formulas).
Formulas, curves and the arc
Formulas accept ordinary arithmetic, sin, cos, tan, sqrt, abs, pow and a seeded random(). Useful starting points:
- Linear growth such as
i*6spaces the polygons evenly.i*i/4spreads them faster toward the outside;sqrt(i)*40bunches them there. - Oscillation such as
10*sin(i/2)rocks the rotation back and forth instead of turning continuously. - Seeded random, for example
i*8+random()*10, adds jitter that stays the same for a given seed.
Starting Angle and Arc Extent restrict each polygon to part of a circle; an extent below 360 turns closed shapes into open arcs. Curve Type lists the d3-shape interpolators: the Closed variants join the last vertex back to the first, Linear keeps corners sharp, Basis and Cardinal smooth them, and Step produces staircases. The squircle option adds Corner Radius and Corner Smoothing controls for rounded rectangles.
Custom SVG Path replaces the polygon with your own path data. In that mode scale multiplies the path coordinates instead of adding to a radius, which suits small motifs such as a leaf or a letterform.
Stroke, fill and paper settings
Width under Stroke is written into the SVG as a stroke width with units; 0.4mm matches a common fineliner. It only affects how the file looks on screen. A plotter draws the path centreline with whatever pen is loaded, so choose the width that helps you judge spacing, not the one that looks best in the preview.
Stroke Start and Stroke End define a gradient across the polygons: the first polygon uses the start colour and the last the end colour, and every path carries its own colour attribute. Plotting software that separates layers by colour will treat each shade as a separate pen, so keep both colours identical for a single-pen plot, or use two or three distinct colours for a deliberate multi-pen design.
Leave Fill off for plotting. A filled polygon exports as a filled shape, which a pen plotter cannot draw; if you want solid areas, add hatching later in SVG Effects. Paper Color adds a background rectangle to the export, which most plotting software will try to draw; turn it off before downloading a plot file. Paper Width and Height are the page size in SVG units and set the exported viewBox; the physical size is decided later in your plotting software.
Prepare the SVG for plotting
Rad Lines exports clean closed paths, so there is usually little to fix. Two checks are still worth doing:
- Drop the file onto Plot Preview to see the drawing at real size on your paper with your pen width. Dense inner rings that looked fine at 800 pixels can merge into a solid blot at 100 mm wide.
- Run it through SVG Optimizer with Sort for Plotting enabled to reorder the polygons and reduce pen-up travel. With many small polygons, as in the spiral example, sorting can noticeably shorten the plot.
Common problems:
- The preview is empty: a formula probably returned
NaN, for example dividing byiwheniis 0. Usei+1in denominators. - Polygons run off the page: reduce the scale formula, lower Quantity, or enlarge the paper size.
- The pen draws the background: Paper Color was on. Turn it off and export again.
- Lines pile up in the centre: raise Min Radius so the smallest polygon is still drawable with your pen.
These figures are browser exports rasterised for the web; no physical plot of them is claimed. For streamline-based designs, continue with the Flow Lines guide.